NVIDIA Corporation
237.47−0.74%
- Market cap
- $5.75T
- Sector
- Technology
- Industry
- Semiconductors
- Employees
- 42,000
- Beta
- 2.22
- 52-week range
- 164.27 – 243.37
Research the market and plan the trade on one keyboard-driven desk, with an AI that cites its sources.
$83/mo billed annually — $997 once a year, or $127 monthly.
Follow one stock through a whole trading day, the way members work it in the terminal.
Moves on every 11 seconds, and waits while you use it.
Every stock trading before the open, ranked by sector against yesterday’s close. Futures and the week’s releases sit beside it.
Each dot is a stock, sized by its volume before the open. Ringed dots made the 08:30 board.
The futures, the releases, and NVDA’s news and filings are real; the pre-market moves, board, plan and research are samples.
$83/mo billed annually — $997 once a year.
7-day free trial · nothing charged until day 8 · cancel in one click.
Type DES, CH or INS to open a panel in link group A, then a ticker, and every panel follows it.
NVIDIA Corporation
Last 237.47High 238.90Low 208.48
24 Aug5 Oct
5 OctNvidia's $20 billion Groq deal faces lawsuit alleging startup's stockholders were shortchanged
5 OctNVIDIA Corporation $NVDA Shares Acquired by Silvant Capital Management LLC
5 OctNVIDIA Corporation $NVDA Shares Newly Acquired by Algebris UK Ltd.
SEC Form 4, as filed.
Three companies chosen on the server; quotes refresh every five minutes; insider rows are SEC Form 4 filings.
Type what you want in your own words; HootAI turns it into filters you can read and remove, and says why each company made the list.
| Symbol | Company | P/E | Sector P/E | Cash flow | Today |
|---|---|---|---|---|---|
| Cisco Systems | 17.8 | 31.4 | 4 of 4 quarters | +0.42% | |
| Qualcomm | 15.2 | 31.4 | 4 of 4 quarters | −0.35% | |
| HP Inc. | 9.6 | 31.4 | 4 of 4 quarters | +0.18% | |
| IBM | 21.3 | 31.4 | 4 of 4 quarters | +0.61% |
Both searches are samples: the first with illustrative figures, the second on the sample board. The wave is a drawing, not a count.
Before the bell, the board ranks the morning’s movers and says why each is on the list: the catalyst, the gap, the volume against its usual pace.
The headlines, filings and disclosures on the companies you follow, read to you while your eyes stay on the chart.
Inflation, Apple, Nvidia, AMD, a Form 4 and a congressman, in 56 seconds.
A sample read, recorded once from the stored headlines and filings of 7 to 11 September 2026.
A year of one member’s disclosed trades, priced and measured against the S&P 500 over the same year, with the method underneath.
 Sheri BiggsR · South Carolina · House · 2025Disclosed portfolio+66.2%S&P 500, same year+26.9%Against the index+39.3%87 trades priced93% complete
 Ashley MoodyR · Florida · Senate · 2025Disclosed portfolio+53.3%S&P 500, same year+24.1%Against the index+29.2%31 trades priced100% complete
 Kelly MorrisonD · Minnesota · House · 2025Disclosed portfolio+55.6%S&P 500, same year+33.7%Against the index+21.9%23 trades priced100% complete
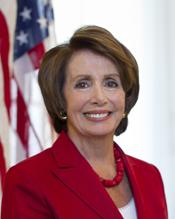 Nancy PelosiD · California · House · 2025Disclosed portfolio+37.4%S&P 500, same year+18.3%Against the index+19.1%19 trades priced94% complete
How it is measured. Each portfolio is measured against an S&P 500 (SPY) position made of the same trades on the same dates — total return, dividend-adjusted closes. Disclosed amounts come as ranges, so we use the midpoint, and share counts are estimated from the price on the trade date. Shown: members whose 2025 portfolio both gained and beat the benchmark, with at least 10 disclosed trades and at least 80% of trades priced — the top 6 by excess return. Excluded: members below those floors, and years still in progress.
Source: Built from public STOCK Act disclosures. · Portraits: Image courtesy of the Member · As of 2026-10-06
Members disclose trades under the STOCK Act well after the trade, and every congressional row on the desk prints that gap.
34daysthe typical gap between a trade and its filing
32.6% of filings arrived after the 45-day window — 385 of 1,182.
Measured across the last 90 days and 1,182 filings. Source: Congress.gov and the STOCK Act filings themselves.
$83/mo billed annually — $997 once a year.
7-day free trial · nothing charged until day 8 · cancel in one click.
Every Saturday, one page on the week: what moved, what the data said, what was filed, and what is on the calendar next, your watchlist first.
230.36 at last Friday’s close, 219.19 by midday Friday. A director’s Form 4, filed Tuesday, reported 1,022,239 shares sold.
August core inflation, month on month, against 0.2% expected. The yearly headline rate held at 3.4%.
The first foldable iPhone arrived at the highest price the line has carried, and the shares opened higher and held.
A sample issue written from the week of 7 September 2026: prices, the economic calendar, SEC Form 4 filings and one Barron’s headline.
Every lesson opens the panel it teaches, points at the figure it is talking about, and marks your answer against it.
Market capitalisation is the share price multiplied by the shares outstanding: what the market says the whole company is worth today. Read it as a size, not a verdict.
A sample lesson, shaped like the real ones. The instructor’s answers were recorded on 15 September 2026, in its own voice.
HootAI reads the records your question needs, none of which answers the whole of it, and shows its work.
The market’s view
The record
HootAI
Read 6 of 8 records
Question: Build me a swing plan for NVDA. Where’s the entry, the stop and the take-profits?
HootAI read 6 of 8 records, and did not need Congress and Value chain.
NVDA gave back 2.37% today on heavier volume, but it is still holding the $214 shelf it built in late August (Price & volume). Rates rose again and volatility jumped 8.38% (Market & macro), so there is no reason to chase.
Nothing underneath has broken. This week’s major stories were about supply and capacity, not demand (News); three analysts raised their targets this month (Analysts); and gross margin held at 71.2% last quarter (Financials & earnings). Insider selling is the scheduled kind the company files every quarter: routine, not a signal (Ownership).
The entry is $214.00–$217.50. Trigger: a daily close back above $217.50 after a hold of the shelf (Price & volume).
The stop is $208.40, 3.41% below the middle of the entry zone. Why there: under the higher low of 2 September, so a close through it means the shelf has failed (Price & volume).
Profits come off in two steps:
A third at $231.00 · The top of the August range
The rest at $242.00 · Just above the year’s high of $236.54, trailed from there
That puts 3.41% at risk for 7.07% to the first target, a risk to reward of 1 : 2.07.
A sample answer with illustrative figures. Nothing here is investment advice.
A sample: the figures, questions and answers are illustrative; the lines and the sphere are drawn.
$83/mo billed annually — $997 once a year.
7-day free trial · nothing charged until day 8 · cancel in one click.
Link your accounts read-only, set the mix you want, and every morning the desk analyzes your holdings against the market and suggests what to rebalance.
Both indexed to 100 on 14 March, the day the accounts were linked.
Where it isThe mix you setAnything more than 1.5 points out is picked up by the morning check.
Sample accounts, holdings and moves. Each suggestion is arithmetic against the mix you set yourself; the desk can never place an order.
Every story is pinned to the minute it was published on the chart of the company it names, and what the price did next is measured, never described.
09:48 ET · A report names AMD among a fund’s option buys.
A sample day: AMD’s 15-minute bars and the headlines published about it on 11 September 2026, each measured from the bar it landed in.
Set a level or add a company to your watchlist, and the desk keeps watch after you close the tab.
The headline, Form 4 and STOCK Act rows are this week’s real records for NVDA; the price level is an example.
Every panel, the board, the plans, HootAI and the courses.
Billed annually — $997 once a year.
Billed monthly. Cancel any time.
7-day free trial · nothing charged until day 8 · cancel in one click. Buying for a team? Seats on one invoice. WiseView provides market data and research tools for educational purposes. Nothing here is investment advice, and past performance does not predict future results.